Blog
Data on Intermodal Freight Transport
Intermodal freight transport, commonly defined as the movement of freight from the rails by truck drivers, has historically lacked an adoption of technology. With the industry as a whole shying away from technology, what data, if any, is there to be collected?
DrayNow is providing drayage service and injecting technology into intermodal freight transport. From this technology, DrayNow has been able to provide real-time, substantial data on the intermodal freight moves from our platform that give a snapshot of overall intermodal freight trends.
Below are some of the data deep dives we’ve completed to bring transparency and real-time information to intermodal freight transport. Click the link attached to each heading to get a full view of each report.
Intermodal Freight Behavior in the Marketplace Model
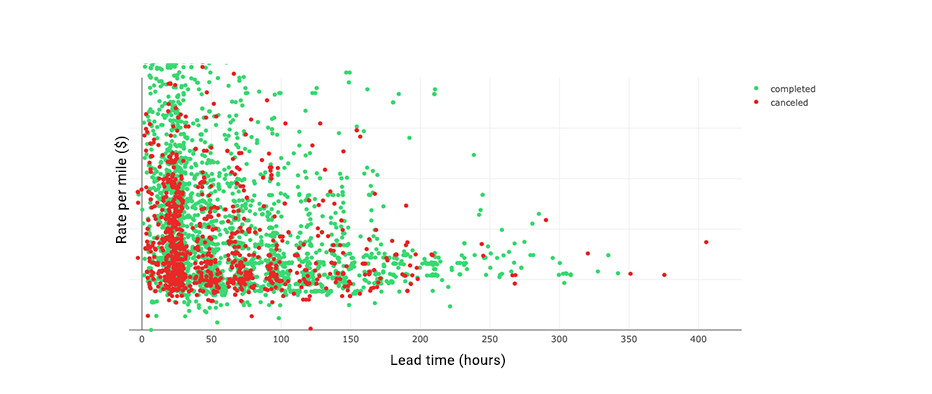
DrayNow took a look at intermodal freight behavior on the platform by comparing the rate per mile and lead time of completed and canceled loads.

The chart above shows the relationship between how many hours a load is posted on the DrayNow platform before its appointment (lead time), and the rate per mile in which that trip was priced at.
The resulting data visualizes that as rates rise, the incidence of loads not getting capacity decreases. This also applies to the lead time, where loads with longer lead times have a better chance of getting covered as truck drivers can plan ahead. The conclusion is that the higher the rate per mile and the longer the lead time, the more likely the load will be taken by a carrier.
Intermodal Freight Appointment Flexibility
On DrayNow’s intermodal freight marketplace, carriers have the option of choosing loads that have wide-open appointment windows or hard appointment times. However, loads with windows have historically been better received by intermodal carriers.
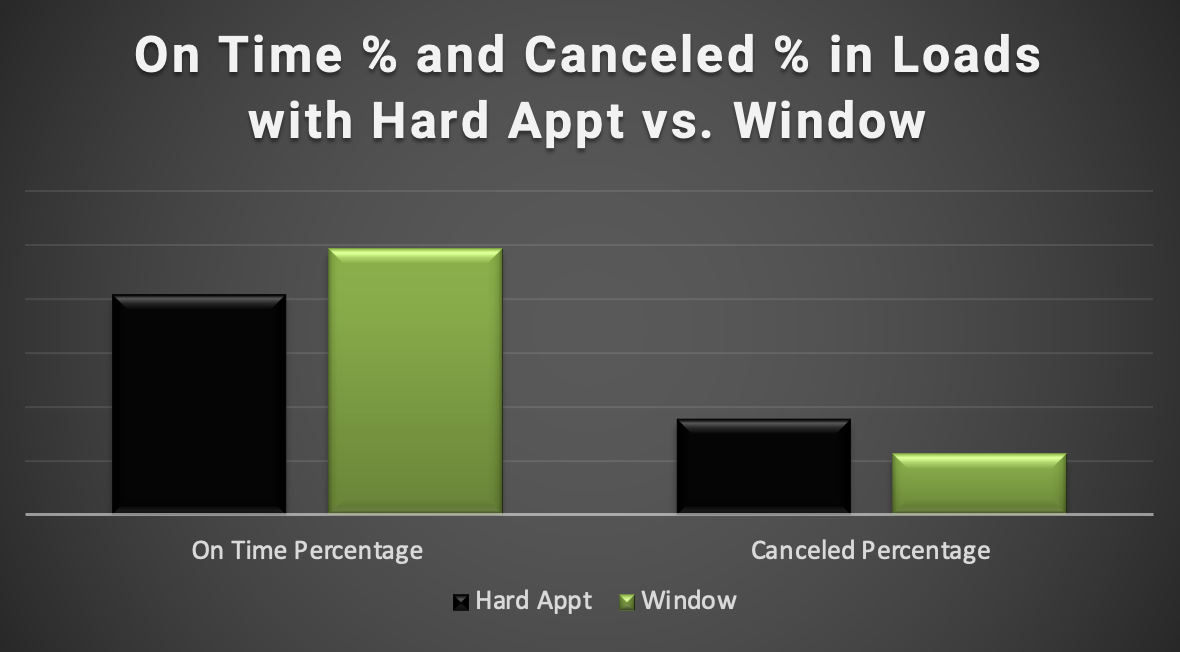
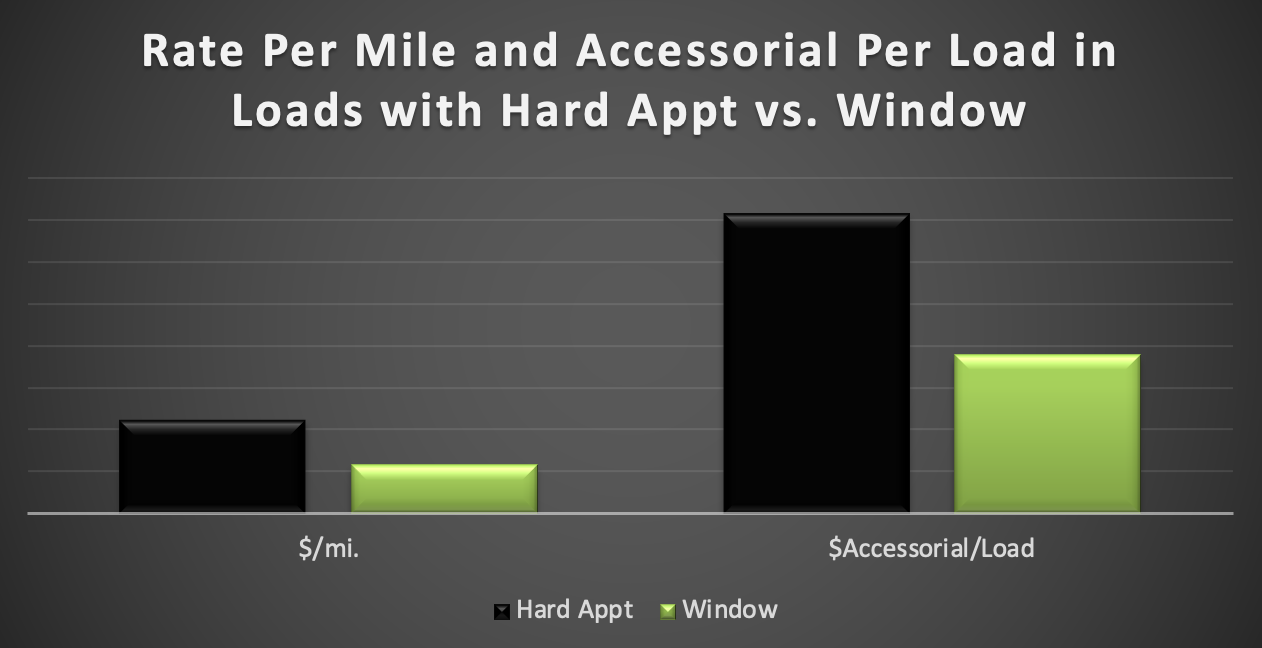
In the charts below, we quantified this data and showed the impact that appointment flexibility has on intermodal freight transport.

This chart shows that intermodal freight moves with an open appointment window have an on time percentage 17% higher relative to loads with hard appointments. On the DrayNow platform, there is also a 12% difference in cancellations between loads with hard appointments and intermodal freight moves with appointment windows.

This chart shows that carriers on the DrayNow app will execute intermodal freight with appointment windows at a rate per mile 52% less than freight with hard appointments. And since there is less of a chance of truck drivers needing detention with appointment windows, customers end up spending less money on accessorials on these loads as well.
Intermodal Drayage Volatility Indexes
Through our technology, DrayNow is able to provide indexes on drayage costs and available capacity based on the intermodal freight that runs on our platform. The charts below are updated with real-time data as it comes in.
The DrayNow 53′ Domestic Rail Intermodal Drayage Volatility Index is a measure of market variations by the changes in U.S. Rail Intermodal Drayage costs. This data is compiled in real time from intermodal freight moved through the DrayNow platform, enabling us to provide substantial data to indicate market trends.
The Accepted vs. Non-Accepted Price Gap Index examines the pricing difference in all intermodal freight that is accepted by carriers, compared with freight that is not accepted. This index demonstrates that when capacity is looser, pricing is less of a factor of acceptance. When capacity is tighter, pricing is critical to acceptance.
To get a look at all of the content surrounding our intermodal freight data, check out our blog here!
Sign Up
Shipping Freight? Get our new E-book.
Download our free e-book "Is there a future for Intermodal Marketing Companies?" and get DrayNow updates delivered straight to your inbox.
"*" indicates required fields