Blog
The COVID-19 Impact on Intermodal Freight
The intermodal freight industry as a whole was greatly affected by the COVID-19 pandemic, with restrictions sending volumes plummeting along with other ripple effects. One year later, the industry is looking a lot different this spring than it did at the same time last year. With DrayNow data, we’re taking a look back at the comeback that intermodal has made.
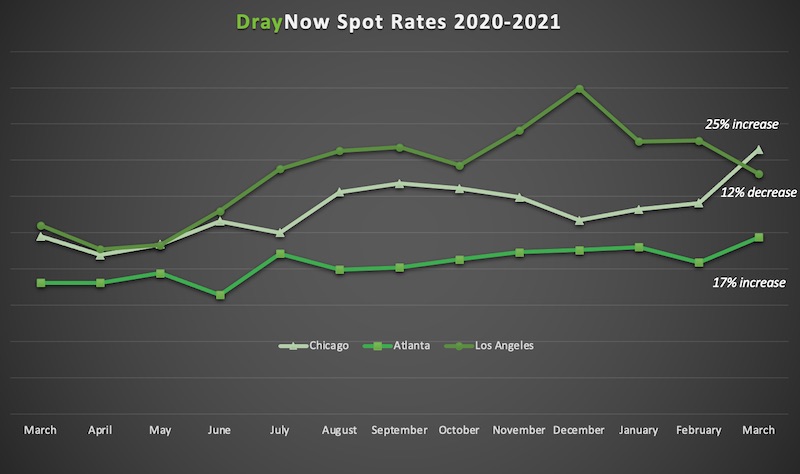
From the Intermodal Spot Rate Tracker above, you can see that spot rates on the DrayNow platform in 2020 began to see a steady decrease starting in March before hitting the lowest average weekly rate of the year in April. This points to loose capacity as volumes dry up and there’s no issue getting coverage for the limited volume available.
These numbers from DrayNow are just a snapshot of what intermodal was experiencing at that time. Industrywide, intermodal volumes were down with COVID-19 and its effects on society being solely blamed.
Looking forward to today, both intermodal spot rates and volumes are seeing changes. Comparing the 8-week periods of the past two years, (3/2/20-4/20/20) & (3/1/21-4/19/21), average spot rates are up 39% in 2021. The (3/2/20-4/20/20) time frame was when the pandemic began to take hold of the country. When comparing the individual weeks in this period, some year-over-year changes are as high as +65%, showing that capacity is tighter this year as volumes are back.
The data points to rising volumes, but by how much? Checking the most recent data provided by the Association of American Railroads (AAR), year-over-year changes in weekly intermodal traffic are around +31% in 2021.

Breaking the average spot rate data by market, the chart above shows that rates are rising and continuing to do so, with a 25% month-to-month increase in Chicago and a 17% increase in Atlanta for March.
It’s also worth noting how much higher March rates appear now than in the same month last year, again, when the pandemic really started to affect freight. In March 2021, Chicago rates are up 49%, Los Angeles rates are up 27% and the Atlanta market is seeing a 35% increase compared to March 2020.
To give even more insight into the cost of intermodal freight transport, we have the DrayNow 53′ Domestic Rail Intermodal Drayage Volatility Index show the year-over-year changes in cost to move an intermodal load. As you can see from the chart by week 10, which includes the beginning of March, the variations in cost start rising more than earlier in the year. By week 14, the percent change in cost is at +57% from last year.
Looking at the 2020 data from last spring, you can also see that intermodal costs were down from where they were at that time in 2019. All of these numbers show a sinking costs in 2020 when capacity was readily available and volumes were down, as well as rising costs in 2021 once volumes are back on track and capacity gets tighter.
It’s clear from this data that the industry is in a much different place than last spring, which is good news for the prospects of a continuing recovery. Consumer spending is up and an improving pandemic situation are bringing hope that there’s light at the end of the tunnel.
Sign Up
Shipping Freight? Get our new E-book.
Download our free e-book "Is there a future for Intermodal Marketing Companies?" and get DrayNow updates delivered straight to your inbox.
"*" indicates required fields